

Rolled out across multiple sites globally, a visual interface powered by NavVis IVION Enterprise makes a substantial contribution to operating margins.
Internet of Things (IoT) devices are featuring more and more prominently in industrial environments. The data they provide help us to make smart decisions about the status of the production line, operations, and myriad tweaks to boost operational efficiency.
Within a modern production facility, multiple streams of real-time data are being generated not just by IoT sensors, but also cameras, programmable logic controllers (PLC), and manufacturing execution systems (MES).
By collecting and analyzing this information across multiple sources, operations managers situated either locally or globally can better optimize the predictive failure reporting in their factories, thereby increasing productivity while reducing maintenance costs and time to resolution.
The status quo with IoT data gathering – and the bottlenecks
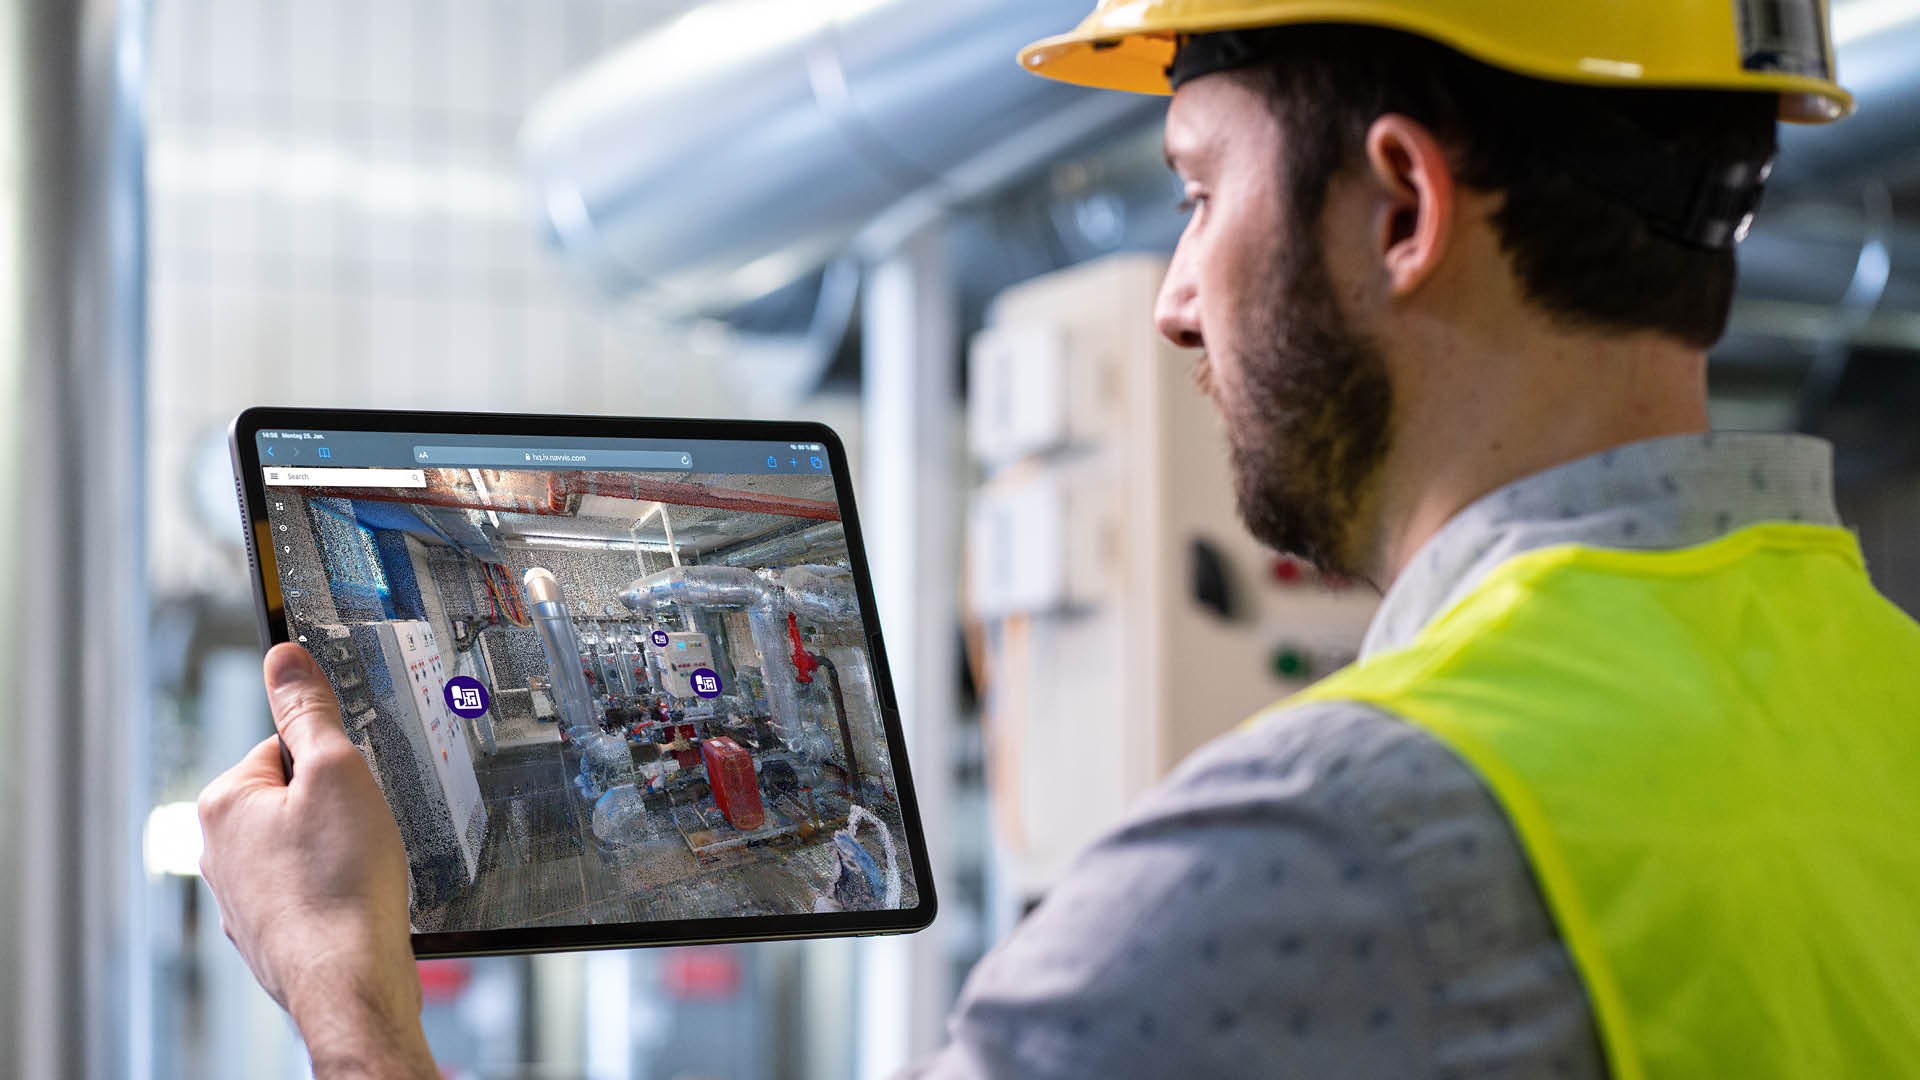
So how do these sensors work in practice? IoT devices are often discreetly installed and are not directly accessible to personnel on the factory floor.
The dashboards through which IoT and asset data is scrutinized have one glaring issue, however, and it concerns spatial intelligence. They don’t have enough information about the context and location of machinery, production lines, or processes. In other words, there’s no tangible link between the data being collected and the physical environment it’s situated in.
Another challenge is complexity. Planning, managing and analyzing a mountain of data in real time is an intricate task, usually limited to specialized personnel. A broader perspective of factory processes is not available at managerial levels, making the detection and communication of a problem more cumbersome.
What else? Well, if data is delivered through multiple platforms with no consideration for interoperability, each piece of intelligence is effectively siloed. It’s not altogether impossible to join the dots and make observations, but information retrieval and analysis takes far longer than it needs to.
Here, too, the omission of spatial context is felt. Without an intuitive way to pinpoint exactly where in the factory building or shop floor the data is coming from, how is it categorized and sorted? If we don’t know where these multiple data sources are coming from, we might overlook how they influence and relate to one another.
Spatial context provides the solution
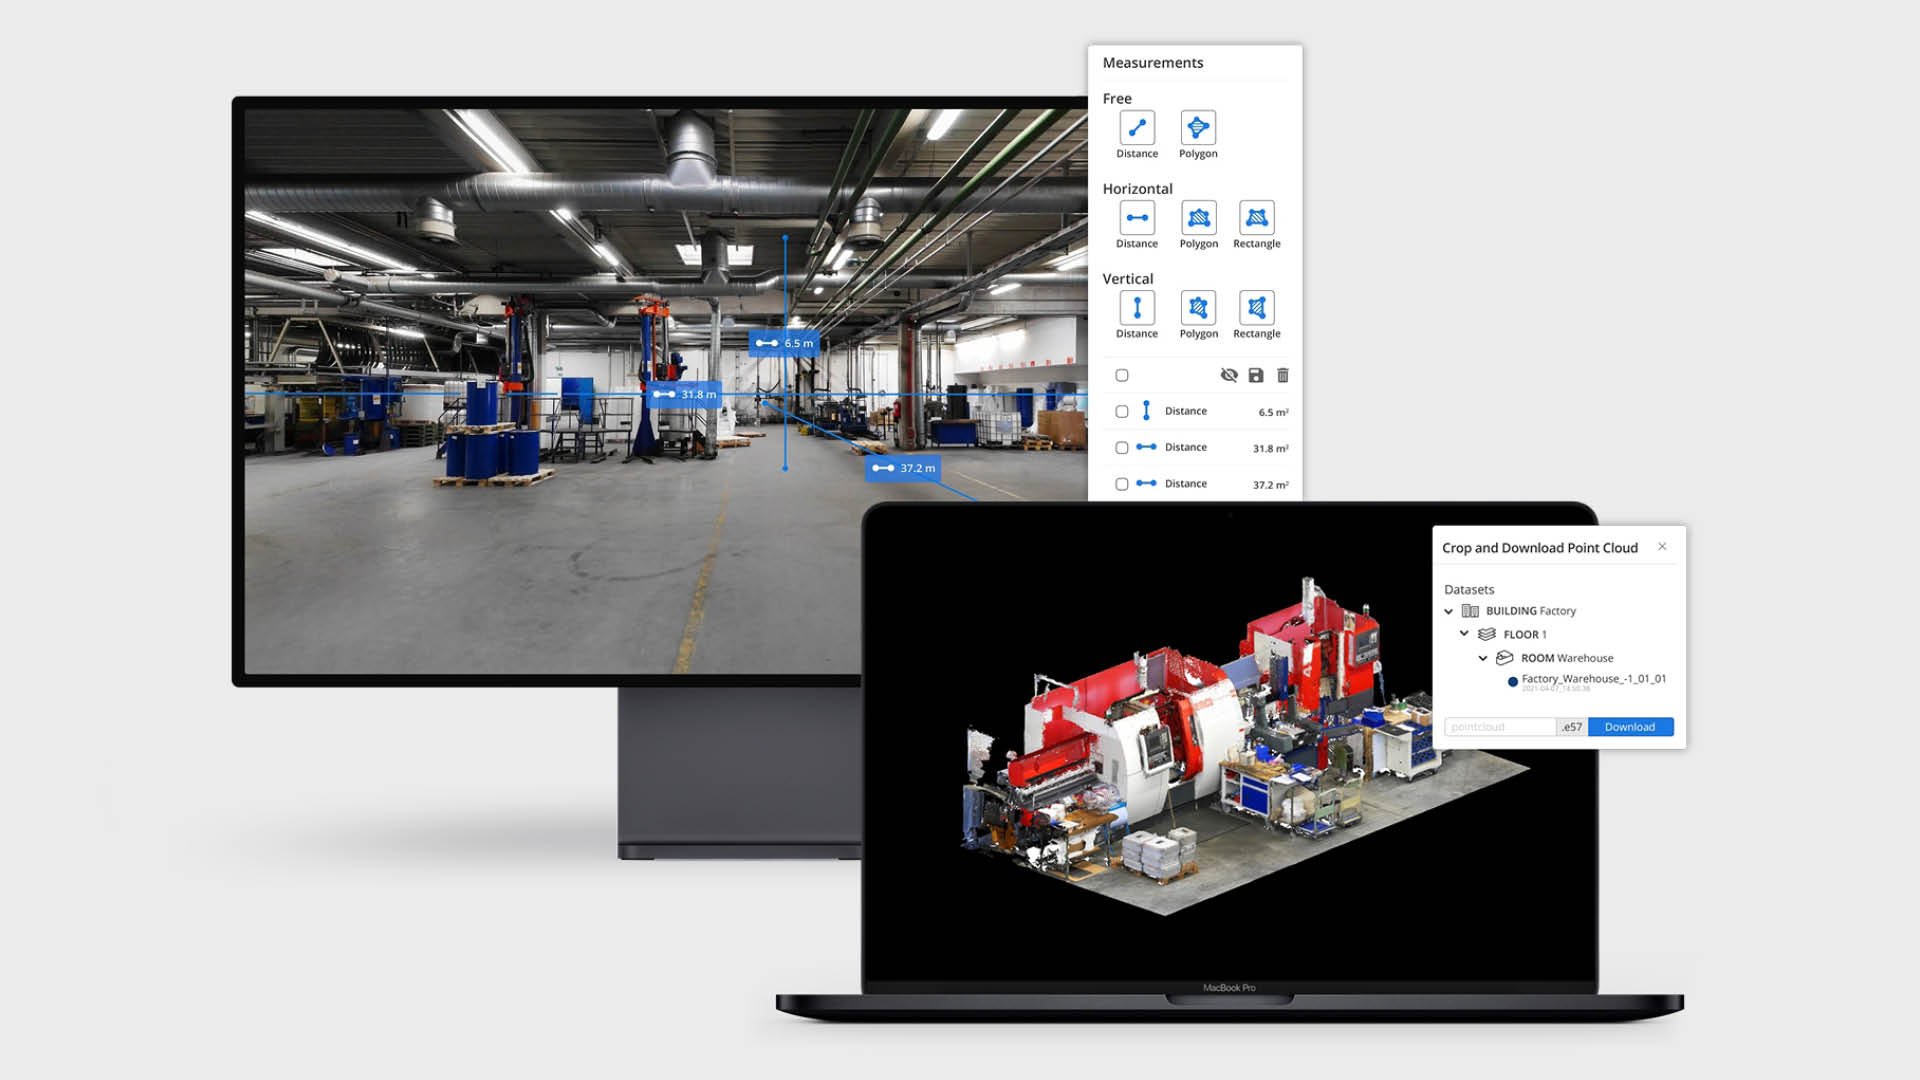
The answer is to supplement IoT (and other smart devices installed at production plants) with positioning data. A dashboard with a visual interface containing spatial intelligence can present a unified data stream with multiple levels of granularity, ranging from the production network or the individual plant, right down to the shop floor or the machine itself.
Production planners and facility managers can access performance insights and identify areas and processes for improvements in real time within the context of factory space. And these insights needn’t be limited to a handful of personnel, but made available to every factory worker for better understanding and efficiency.
Using NavVis IVION Enterprise, for example, you can execute basic commands and controls directly. And you can compare the performance of similar areas in different production sites, identifying areas of commonality and scope for improvement. You could even establish a layout “benchmark” with the best performance and use that as the basis for setting up a new factory or production line.
Wrapping up
In summary, by adding the spatial context to IoT sensors and their like, operations managers are empowered to make better decisions. Locative awareness supports planning, management and analysis.
Tasks like predictive maintenance are improved through a greater understanding of the environmental context. Other benefits might be a reduction in downtime, and an uptick in asset utilization and productivity. Standards are raised across the production network, without a spike in the effort required for coordination across sites, time-zones and countries.
Rolled out across multiple sites globally, a visual interface powered by NavVis IVION Enterprise will make a substantial contribution to operating margins.
Would you like to learn more about the NavVis Digital Factory Solution? Contact us for more information, or download a copy of our free guide to getting started with your digital factory implementation.